Outlines and Graphic organizers
Graphic organizers
- need more time to process than outlines
- are of little value when the text is short and simple
- are helpful for constructing super-clusters
Outlines
- are easier and quicker to process than graphic organizers
- are better for shorter, simpler texts
- are effective for rote-learning facts
Graphic summaries are summaries that reorganize the text. Two examples of graphic summaries are outlines and graphic organizers.
In an outline, topics are listed with their subtopics in a linear format, like this:
Branches of Government (U.S.A.) |
|||
|
I. |
Executive Branch |
|
|
|
|
A. |
Represented by: |
President |
|
|
B. |
Powers: |
Can recommend legislation; veto legislation; appoint judges |
|
|
C. |
Length of term: |
4 years; maximum term 8 years |
|
II. |
Legislative Branch |
|
|
|
|
A. |
Represented by: |
Congress |
|
|
B. |
Powers: |
Can enact legislation; override veto; reject and impeach judges; impeach President |
|
|
C. |
Length of term: |
2 years (House of Representatives) or 6 years (Senate); no maximum term |
|
III. |
Judicial Branch |
|
|
|
|
A. |
Represented by: |
Supreme Court and other federal courts |
|
|
B. |
Powers: |
Can declare legislation unconstitutional |
|
|
C. |
Length of term: |
life |
Graphic organizers show the same sort of information, but in a more visual format, like this:
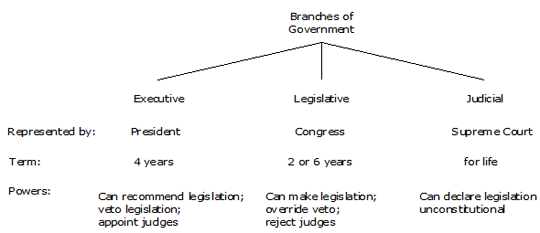
This is a tree diagram. Although graphic organizers can come in many forms, most commonly they are either tree diagrams or matrices. Here is a matrix of the same information:
|
|
Executive Branch |
Legislative Branch |
Judicial Branch |
|
Represented by |
President |
Congress |
Supreme Court |
|
Term |
4 years |
2 or 6 years |
Life |
|
Powers |
Can recommend legislation; |
Can enact legislation; |
Can declare legislation unconstitutional |
Basically, graphic organizers are visual outlines showing relationships. Both outlines and graphic organizers are useful strategies for hierarchical information. However, while an outline does pick out the most important information and does show hierarchical relations (and, as you may have noticed, can include more detail more easily), it is not as effective in showing the relationships between concepts.
Compare the examples. In the outline, the clusters within a topic are clear, but the relations between topics — between the clusters — are not. The graphic organizer, on the other hand, allows connections between clusters to be more readily seen. Notice how much easier it is to grasp the similarities and differences between the different branches of the U.S. Government when looking at the tree diagram or the matrix, compared to looking at the outline.
In general, graphic organizers are more effective than outlines — but not invariably. In a study involving text summaries, graphic organizers were superior only when the students had enough time to study them properly — but where the students did have enough time, those who had studied the graphic organizer tested just as well after two days as they had when tested immediately, while those who had studied the outline performed more poorly (and those who had only read the text were worst of all). In other words, graphic organizers are much better for long-term recall (which is, after all, what you usually want!). This appears even more true when the text is longer.
But graphic organizers can be less effective than outlines, and this may be because graphic organizers can make it too easy to see the relations, and the reader doesn’t need to work as hard to understand the material, with the consequence that the material isn’t processed to the extent that it needs to be for lasting memory. This doesn’t apply, of course, if you’re constructing the graphic organizer yourself.
Graphic organizers have an advantage over outlines in terms of cognitive load. Working memory is thought to have two sub-systems — one that is essentially visual, and one essentially auditory. When we read text, notwithstanding we are receiving the information through our visual sense, we tend to encode it through the auditory working memory (words are fundamentally sound-based). There is evidence that graphic organizers use visual working memory more than auditory, while outlines use auditory more than visual. The advantage of a graphic organizer, therefore, may lie partly in its reduction of cognitive load — that is, by spreading the load on working memory between both systems.
Additionally, of course, the use of visual information in addition to verbal information creates more retrieval paths, increasing the chances of finding the information again.
All of this means that if outlines or graphic organizers are provided for you, even if the same information is also provided in the text, it’s worth spending time studying the outline/graphic. If an outline is provided, consider re-drawing the information as a graphic organizer.
As far as producing these yourself is concerned, outlines are easier to produce than graphic organizers, which is why they are much more popular. Although outlines are in general less effective than graphic organizers, both are generally more effective than conventional notes.
In two studies comparing note-taking formats in a ecture, both outlines and matrix notes were usually more detailed, better organized, and contained more ideas. Matrix notes were also slightly more coherent. But of course, the material was compatible with a matrix format, which is not always the case.
Although a graphic organizer is more effective, an outline is certainly sufficient in the right circumstances. Because it is easier to construct than a graphic organizer, if the material can be adequately described in an outline, you should use it. This will depend partly on the material itself, and partly on your goal. If you’re simply aiming to learn the “facts” (i.e., you’re not trying to develop your understanding), then research indicates an outline will be just as productive as a graphic organizer. If the text is short (1000 words or less), an outline is probably better. But with longer and more complex material, it would seem that graphic organizers are worth the trouble. In such cases, research also suggests that several graphic organizers are most effective — a warning that we shouldn’t try to cram too much information into a graphic organizer.
Remember, too, that graphic organizers, like outlines, are not designed to provide full notes — so you shouldn’t be trying to include everything. It’s all about selecting what’s important.
- Benton, S.L., Kiewra, K.A., Whitfill, J.M. & Dennison, R. 1993. Encoding and external-storage effects on writing processes. Journal of Educational Psychology, 85, 267-80.
- Bera, S.J. & Robinson, D.H. 2004. Exploring the boundary conditions of the delay hypothesis with adjunct displays. Journal of Educational Psychology, 96(2), 381-388.
- Kiewra, K.A., Dubois, N.F., Christian, D., McShane, A., Meyerhoffer, M. & Roskelley, D. 1991. Note-taking functions and techniques. Journal of Educational Psychology, 83, 240-5.
- Robinson DH & Kiewra KA 1995. Visual argument: Graphic organizers are superior to outlines in improving learning from text. Journal of Educational Psychology, 87, 455-67.
- Robinson DH & Molina E 2002. The relative involvement of visual and auditory working memory when studying adjunct displays. Contemporary Educational Psychology, 27, 118-31.